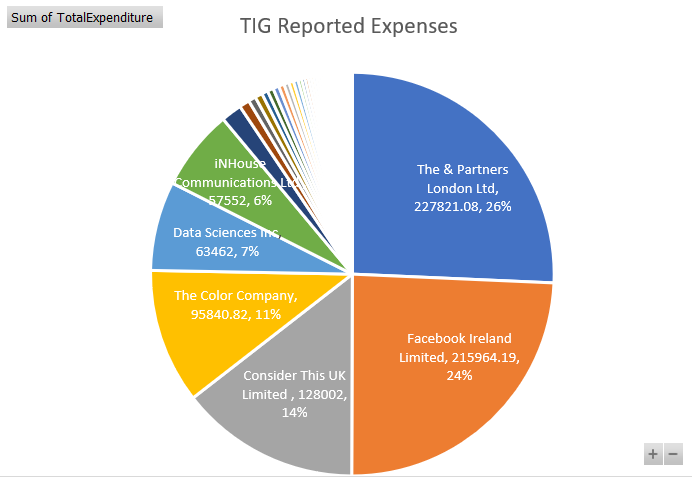
A bit more on the Independent Group’s accounts. Here’s a chart breaking down their expenses by supplier, which really does show how much of a creation of the advertising/marketing/public relations industry they were:
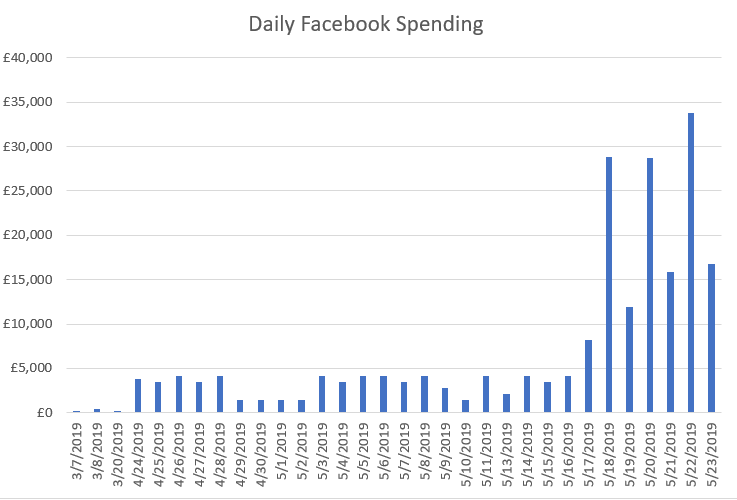
Here’s the daily spending on Facebook advertising:
And here’s the history of their spending with The & Partnership, by category:
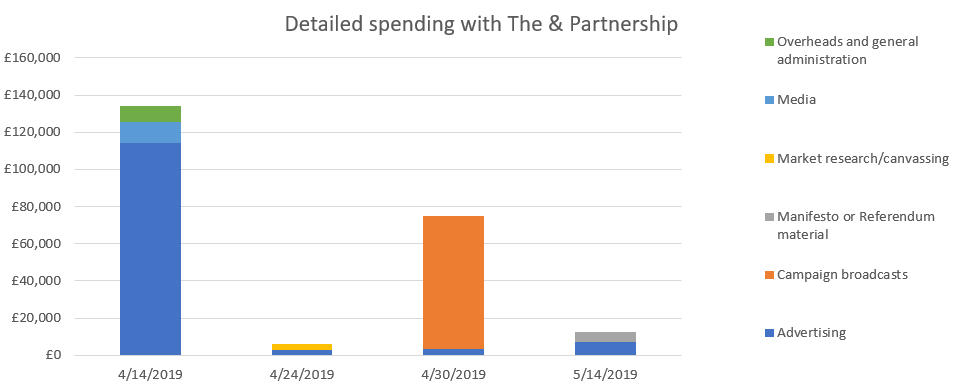
You can clearly see that they hired &, first of all, to build them a political party from scratch in April, and then to create their election broadcast.
“Hired”? & were their biggest single donor (in kind, presumably).
Yes, see the previous post. &’s in-kind donations amounted to roughly half the spending.