It seems to be TYR Service! day, so I followed up on a discussion elsewhere about social trust in the UK by analysing Ipsos MORI’s polling series on trust by profession.
Having fiddled with various ways of filtering the data in an attempt to get a readable line chart, I decided to look at net trust – i.e. trust minus distrust – and concentrate on the change in each series, and to compare the average of the first 10 years (1983-1993) to the last 10 years in order to avoid either chasing outliers or throwing away too much data. Then, I remembered the First Canonical Principle of Data Visualisation: if your chart is not a horizontal, sorted bar chart, it probably should be.
The upshot is a bit of a surprise, although the strong increase in net trust (well over a 2 standard deviation result) for civil servants and trade unions stuck out literally whatever analysis I tried. Viva el blob, indeed. (The spreadsheet is here.)
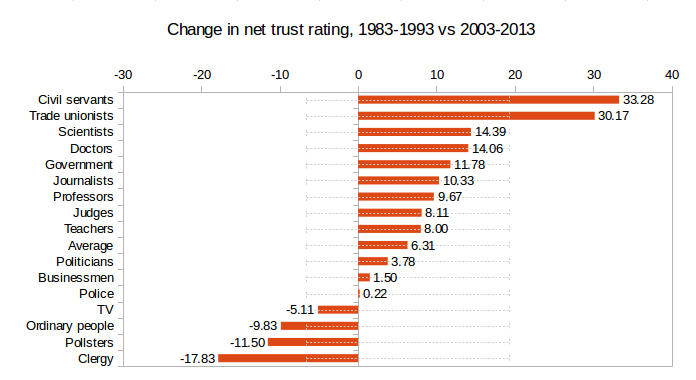
And I really, really wasn’t expecting an increase in average trust, although I’m not sure that’s a sociologically meaningful measurement here, especially as “ordinary people” lost 9.83 percentage points of net trust, a 1.3 standard deviation result. The clergy has taken a real beating, for obvious reasons, while scientists did really well (another surprise). TV did poorly. Nothing whatsoever happened with regard to the police.
Business, which I was asked about, is a difficult one; the result here is that its net trust went up, but by so little (0.39 standard deviations) it might well not have changed at all. However, a lot depends on where you stick the pin in the donkey. The rating for 1983 was very low, -40, no surprise, rose from there to -25 in 1993, declined again and hit -37 in 2002. Not surprisingly, it hit -41 in 2009. Perhaps more surprisingly, it also hit -39 in 2005 and -25 in 2006. It’s now at -23, which could be considered a record high. However, it could also be described as fluctuating around an average of -31 since forever; fitting a linear regression through it gives you an R2 of 0.04, aka nobbut bugger all. Essentially all the change is accounted for by 1983, and as we have seen, it reverses to that level whenever there’s a recession and sometimes just for a laugh.
And if you ask specifically about bankers, well…that said, what have those pollsters been up to?
I wonder if the “rigged polls” meme of the US right is leaking? The idea that all polls showing results unfavourable to one’s politics are automatically suspect, and rigged or “skewed”.
Micro-categorisation is probably important. “Business” is very large, so is “government”. I’m surprised that Snowden hasn’t had an impact.
Snowden hasn’t had time to show up in the series. I’d be surprised if skew-obsession had, either. You know who is really into poll denial? The French, especially the Canard Enchainé folks.
Ever looked at BTL comments on a Scottish referendum poll article…?
“Trade unionists” is surely a batting average effect – all the ones that people really disliked are gone.
Indeed, but it’s also interesting that hopping up and down yelling McCluskey!!! has so little resonance now.
It’s worth pointing out that the question is “For each [profession], would you tell me whether you generally trust them to tell the truth or not?”
Trusting in truthfulness seems pretty different from trust generally – and it’s even more surprising to me that it has been going up.
Also fun is the difference between trust in TV newsreaders (69%) vs. journalists (21%). I guess it just shows how sensitive surveys are to the specific words used.
Arguably even more interesting that hopping up and down yelling Mark Serwotka!! has so little resonance – a bona fide ex-Trot, but both his own profession and that of his members are apparently (and rightly) regarded as highly trustworthy.
Permalink