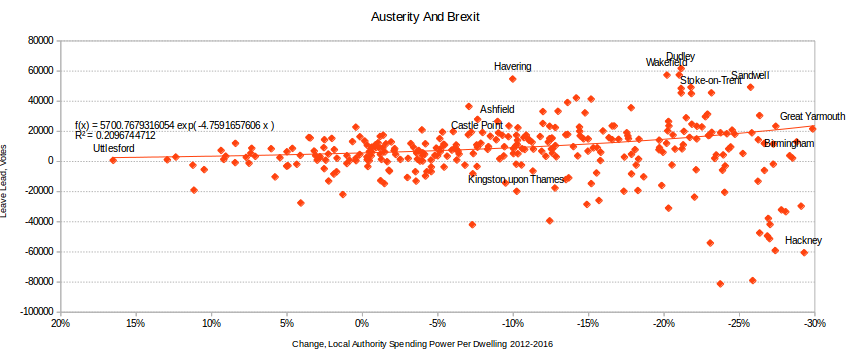
Picking up on a tip from Jo Mitchell’s excellent post here, I replotted the data in the previous post using the Leave lead in votes, rather than percentage terms. This is, of course, appropriate because referendums aren’t counted in terms of parliamentary constituencies. Also, this means that tiny outlier constituencies – looking at you, South Holland and the Deepings – aren’t overrepresented relative to places like, well, Birmingham.
A couple of interesting things result. For a start, the R^2 value doubles to a whole 0.21! I win at data! Secondly, putting the Fenland outliers back in their box tells us something interesting and important, which is that austerity-battered northern and midland cities contributed hundreds of thousands of net Leave votes. Not only was winning in Boston, Lincolnshire probably impossible, it couldn’t possibly have helped in the light of relative failure in the West Midlands. There are lots of people in Birmingham. Labour’s Midlands problem is a thing.
Pulling London out of this doesn’t help much. R^2 nudges up by a hair. It further confirms, though, that you should stop obsessing about tiny places that voted weirdly, and worry about big ones that voted kind of normally but for the wrong side.
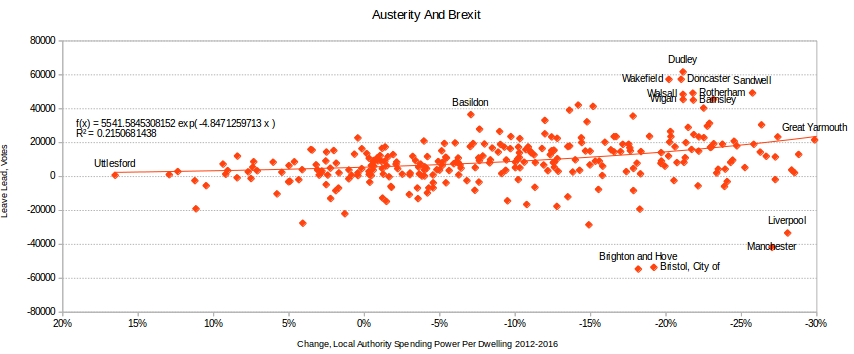
In that way, the Breferendum was far more like a parliamentary election than it seemed. Where it was decided, austerity does actually seem to have mattered quite a bit.