The Monkey Cage has an interesting post on how British political parties spent their money in the 2015 general election.
Specifically, they plotted spending as a percentage of the short campaign limit against how marginal each seat was. The more marginal a seat is, the greater chance you have of picking it up – or losing it, depending on whether you’re the incumbent. Therefore, a rational campaigner would commit their resources to seats proportionately to how marginal they are.
If you think of marginality in terms of positive for your marginals, negative for theirs, you’d expect to get a plot with a peak in the middle of the marginality distribution. An incumbent party would choose to peak just on their side of zero, a challenger just on the other side. The Cage’s plots look like this.
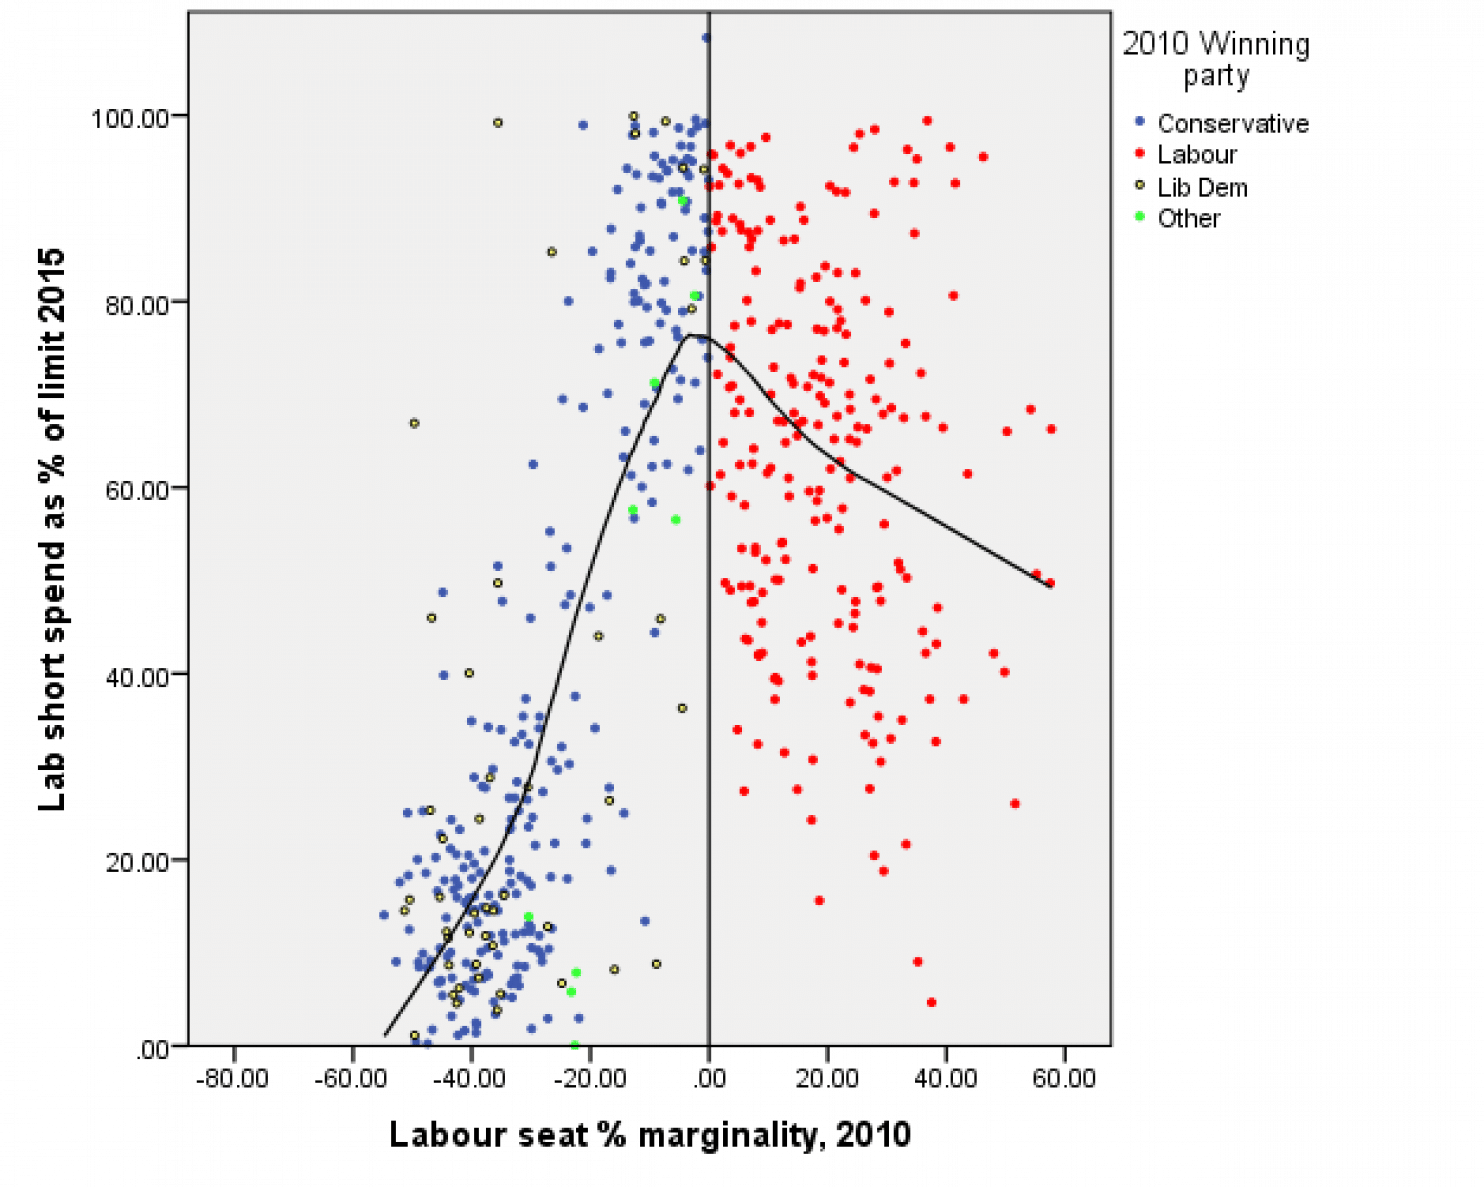
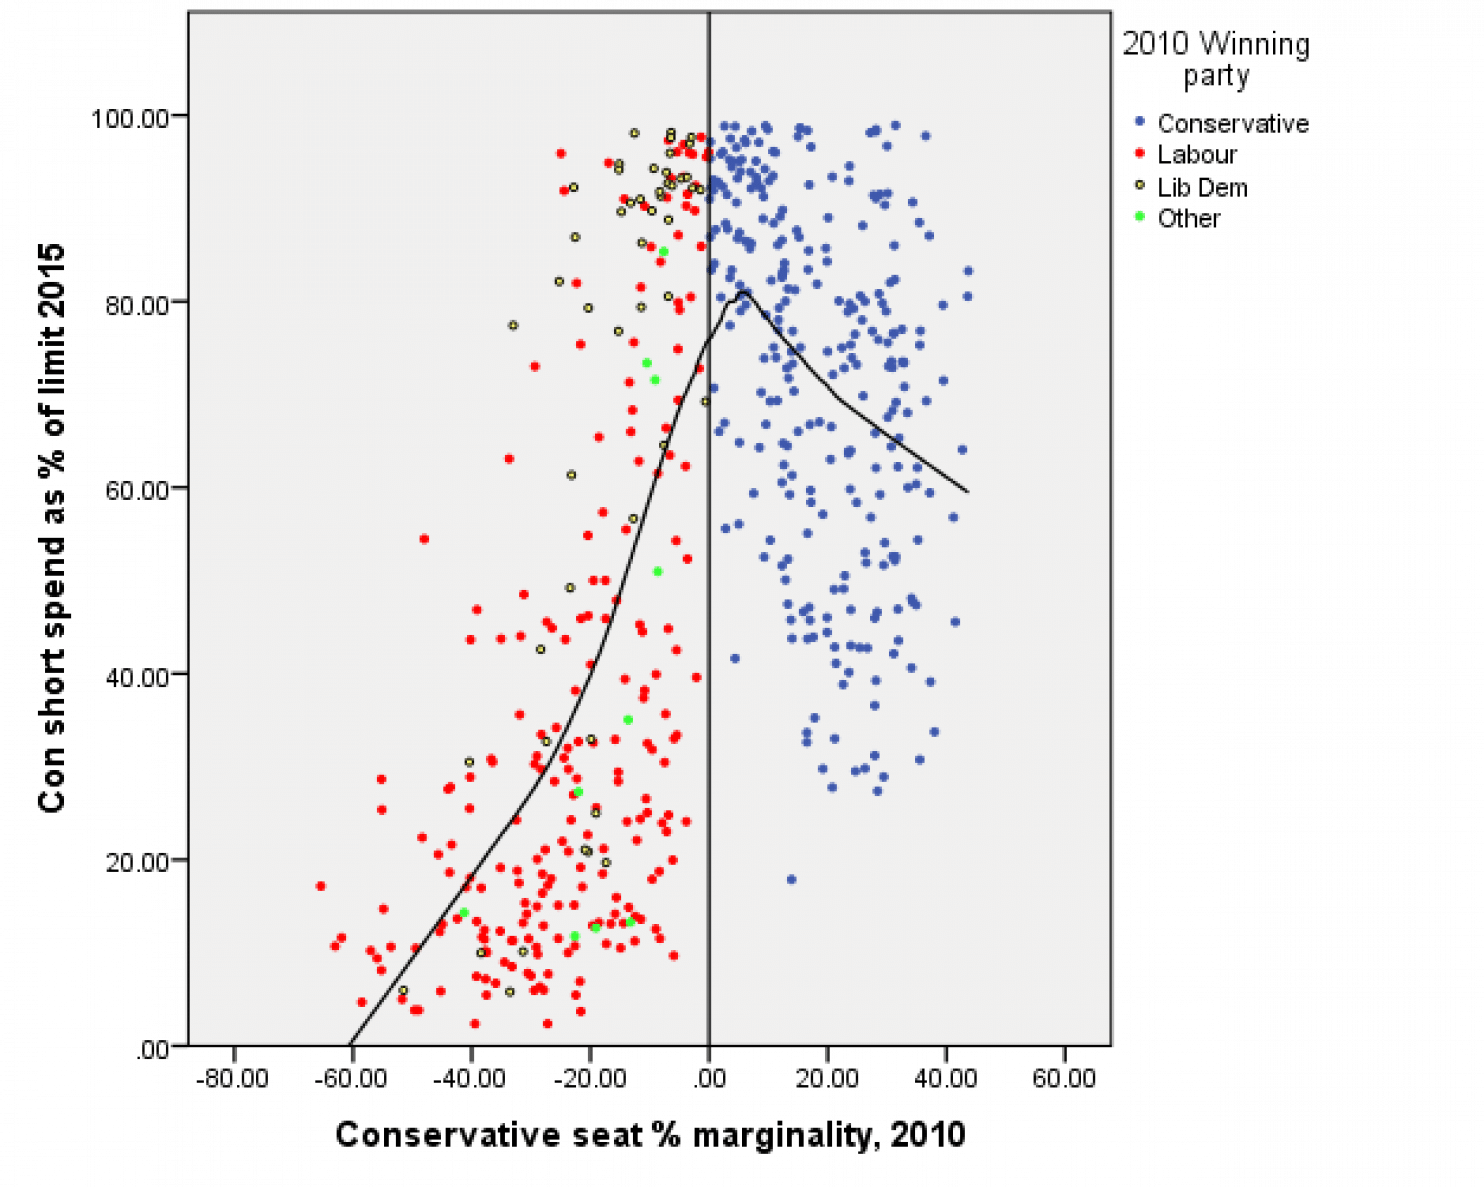
A couple of things stand out. It struck me that the targeting process seems to be less ruthless than we tend to imagine – both parties have a lot of fairly safe seats that get a lot of resources. Also, the curves are asymmetric.
Winning a seat that you wouldn’t otherwise have won is worth, obviously enough, one additional seat. But holding a seat you would otherwise have lost is worth exactly as much – one additional seat. You shouldn’t put more effort into your 70th percentile seat than you do into their 70th percentile seat, but evidently they do. There might be an opportunity to do better by shifting resources from safe seats, and pushing more marginals up to the 100% mark.
This could be an example of psychological loss-aversion, a constraint resulting from intra-party politics (for example, if the safe seat MPs are too important in the party to starve of funds), or an artefact of the hard legal limit on spending. If you’ve reached 100 per cent of the limit in all your target seats and you have money left over, why not use it? However, so few seats hit 100% that we can probably rule that one out. Another possibility is that seats don’t necessarily stay safe, and parties want to maintain their infrastructure in case of a sudden SNP, Green, or UKIP insurgency.
Another thing that struck me is that I found the charts difficult to compare by eye. What I wanted to know was which party’s targeting was closest to an optimal strategy. So I redid the whole thing. I started off with the Electoral Commission dataset and wasted a lot of time trying to match a share-of-vote dataset to it that had nonstandard constituency names. Then I found the British Election Survey’s data, which has the same constituency UIDs as the Electoral Commission. I defined marginality as the percentile rank of the winning party’s vote less the second placed party’s vote as a percentage of the total vote cast, so my charts have an absolute rather than party-relative scale.
The slope of the trend lines should tell us how aggressively the party in question targeted their spending on marginal seats. Their level, meanwhile, should tell us how well-funded the party is overall. So here goes. First, the numbers for the short campaign.
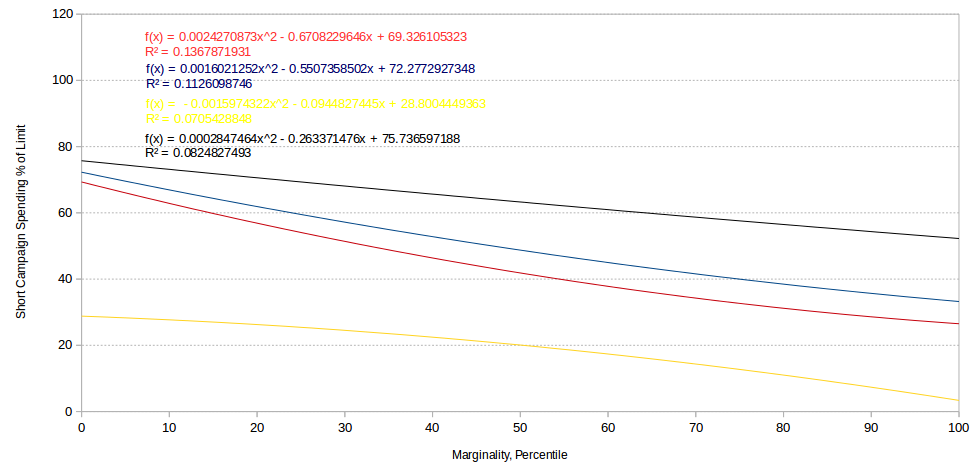
Interestingly enough, Labour was the closest to an optimal allocation, although as you can see from the chart nobody was very close. The slope is given by the second term in the equation, in this case -0.67x, which compares to -0.55x for the Tories, or in other terms, a targeting advantage of 18%. The overall level of funding is represented by the constant, which tells us that the Tories were about 4% better-funded across the board. If it was just a question of getting enough munn into the marginals, we ought to have been OK.
I was sceptical of the Cage’s conclusion that Labour probably couldn’t get much better at targeting, but it looks like they might be right. However, their calculation is based on the impact on the average constituency, and of course it’s not the average constituency but the average marginal that counts.
The best-funded party in the UK, though, turns out to be the SNP, in black on the chart. They were about 9% richer than Labour and about 5% richer than the Tories. Interestingly, neither the SNP nor the Lib Dems bothered with targeting their spending in 2015. I interpret this to mean that they are well aware what their targets are – the subset of seats where they are competitive at all. The SNP had easily enough cash to blanket the whole of Scotland, and it looks like responding to this drove Labour to spend a lot of money in supposedly safe seats in Scotland. Meanwhile, the Lib Dems had relatively few MPs and no choice but to fight for each one. In fact, it looks like the equivalent of the big parties’ “target the top 100 marginals” strategy for a small party is “pick a subset and target them all”.
This is even clearer looking at the long campaign.
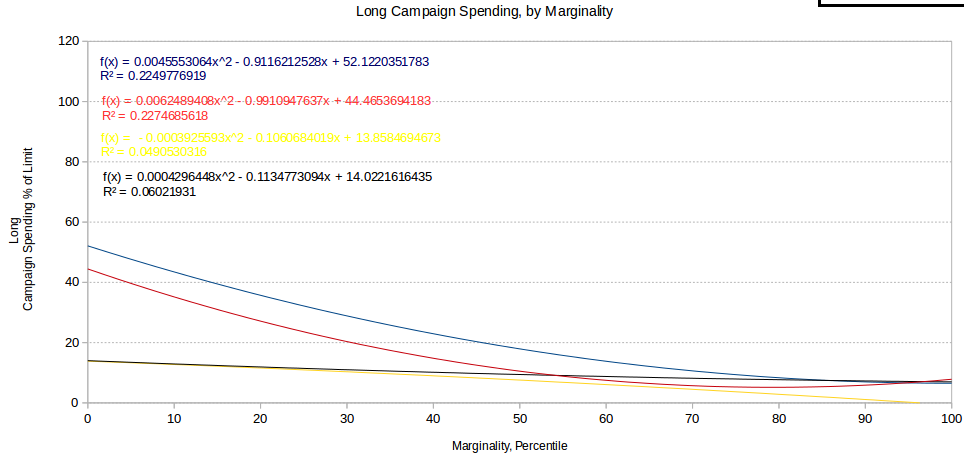
Tory long-term spending was about 18% higher than Labour’s, and Labour compensated about half of that through better targeting. Meanwhile, neither the Liberals nor the SNP really bothered with the long campaign, choosing to keep their powder dry. Interestingly, the Tories spent significantly more in the long campaign than Labour did.
Now, here’s a question for you. This is all very well but it assumes that the parties told the truth to the Electoral Commission. The Tory national campaign return contains no less than £4.7 million in spending on “market research/canvassing”, or as Tim Fenton points out, £47,800 each for the top 100 marginals – including £46,787 they accounted for as going to the Wirral Area Conservative Association itself, very close to a top 100 allocation. So what if we replotted that including this money?
The next chart shows the total spending, short and long, as a percentage of the total limit, and plots both what the Tories declared as local spending – in sky blue – and what that would look like allocating the missing millions evenly to the top 100 marginals, in dark blue. Or as we might also call it: the truth.
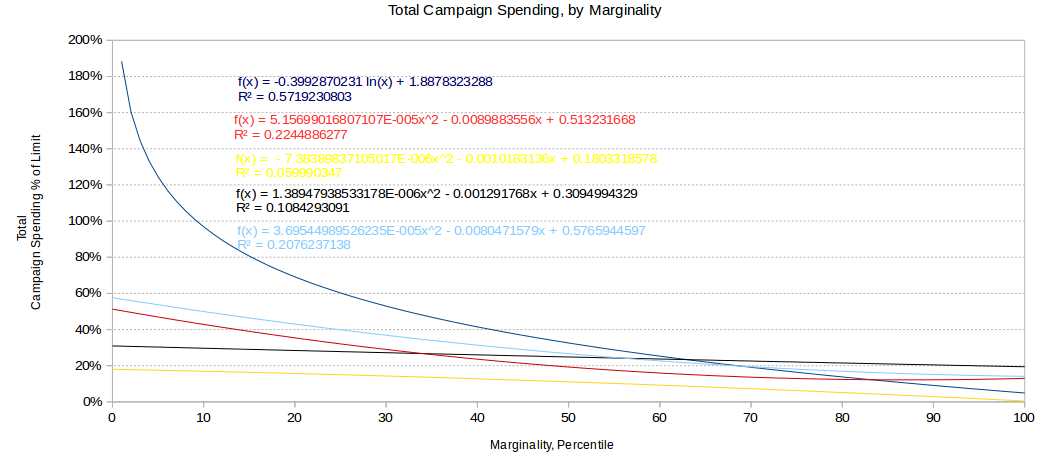
Not only are the Tories’ local campaigns vastly better funded on this basis, the targeting coefficient has absolutely exploded, by a factor of 49. So much so that the series is now logarithmic. The Monkey Cage reckons the Tories could expect about 4 percentage points of additional vote share by getting a typical constituency to the spending limit. Their median top-100 marginal spent 61%, without the dark money, and 156% with it. Very roughly, then, we might estimate an uplift in their share of vote of 8 to 10 points. So, that’s how you get to be prime minister if you fuck pigs. (Also, I note that the Lib Dems’ colourful Majid Nawaz doesn’t seem to have filled in their return from ultra-marginal Hampstead and Kilburn – both long and short spending is given as zero, and there’s no way that’s right.)
You can get the spreadsheet here.
Very interesting to me, as it casts a revealing light on David Allen Green’s slightly irritating “move along nothing to see here” spiel about the election fraud inquiries. Thinking about those inquiries in terms of prosecutions and by-elections misses the fact that the Big Road Trip won’t happen again and that without it those constituencies will have to be defended with a ground game made up of a smaller number of cadre, many of whom will be dead or nearly so. If it also means much tighter spending limits on marginals, things get interesting.
To clarify, that’s the Messina push-polling ‘hidden millions’, not the Battlebus – adding in those costs, did we but know how, would presumably make that dark blue curve even prettier.
D^2 – good point. I think the next election is going to be more interesting than most people think. The received wisdom is that Labour’s terminally screwed & will lose seats left & right. But they’re averaging 30-34% atm, which – although far too low to actually win, much lower than it should be at this stage of (etc etc) – is ahead of the 29% of the vote they took in 2015. So I’d anticipate some gains even if the election was held tomorrow. Add a bit of an LD recovery, some UKIP spoiling and the no-Battlebus effect, and the chance of another Tory majority seems non-existent. I don’t think we’ll be seeing another Tory-LD coalition any time soon, either.
We shall see – sooner than we think, if any of the horrible scenarios outlined by Mark Mardell comes to pass.
The Labour data might be more useful for England (or E&W), given the peculiar trait of “safe seats” which were all lost in Scotland.
Sorry, I also hate double-commenting – Phil, do you think Labour decline from Ed M’s heights this time last parliament to the GE is an artefact of bad polling? Actually, this is partly another issue where polls that include Scotland are remarkably unhelpful.
As in polls getting more realistic? I don’t think so; there was still a big difference between the neck-and-neck polls of April & May 2015 & the actual result. I suspect the factors that dragged the vote down were what they appeared to be – a slight recovery for the LDs, a slight recovery for the Tories, the SNP eating their lunch in Scotland and, towards the end of the five years, a surge for UKIP hitting Labour and the Tories fairly evenly. But instead of going from a 10-12% lead to level pegging, presumably Labour really went from a 6-8% lead over the Tories to 4% behind.
Permalink